Python
Matplotlib Subplot
grace21110
2023. 11. 7. 09:10
반응형
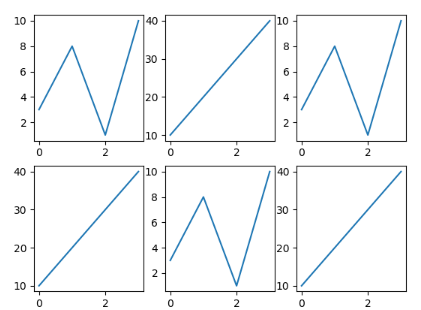
The subplot() function takes three arguments that describe the layout of the figure. The layout is organized in rows and columns which are represented by the first and second agrument.
Example
plot.subplot(1, 3, 2)# the figure has 1 row, 3 columns and this plot is the second plot.
Example
import matplotlib.pyplot as plt
import numpy as np

x = np.array([0, 1, 2, 3])
y = np.array([3, 8, 1, 10])

plt.subplot(2, 3, 1)
plt.plot(x,y)

x = np.array([0, 1, 2, 3])
y = np.array([10, 20, 30, 40])

plt.subplot(2, 3, 2)
plt.plot(x,y)

x = np.array([0, 1, 2, 3])
y = np.array([3, 8, 1, 10])

plt.subplot(2, 3, 3)
plt.plot(x,y)

x = np.array([0, 1, 2, 3])
y = np.array([10, 20, 30, 40])

plt.subplot(2, 3, 4)
plt.plot(x,y)

x = np.array([0, 1, 2, 3])
y = np.array([3, 8, 1, 10])

plt.subplot(2, 3, 5)
plt.plot(x,y)

x = np.array([0, 1, 2, 3])
y = np.array([10, 20, 30, 40])

plt.subplot(2, 3, 6)
plt.plot(x,y)

plt.show()
Result
- Title
You can add a title to each plot with title() function and entire title by using suptitle().
import matplotlib.pyplot as plt
import numpy as np

#plot 1:
x = np.array([0, 1, 2, 3])
y = np.array([3, 8, 1, 10])

plt.subplot(1, 2, 1)
plt.plot(x,y)
plt.title("Price")

#plot 2:
x = np.array([0, 1, 2, 3])
y = np.array([10, 20, 30, 40])

plt.subplot(1, 2, 2)
plt.plot(x,y)
plt.title("Sales")

plt.suptitle("My Brand")
plt.show(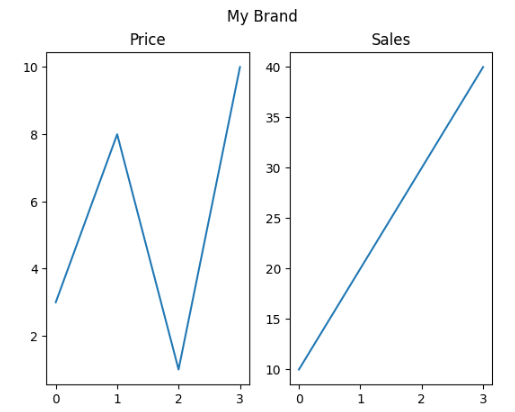
Exercise
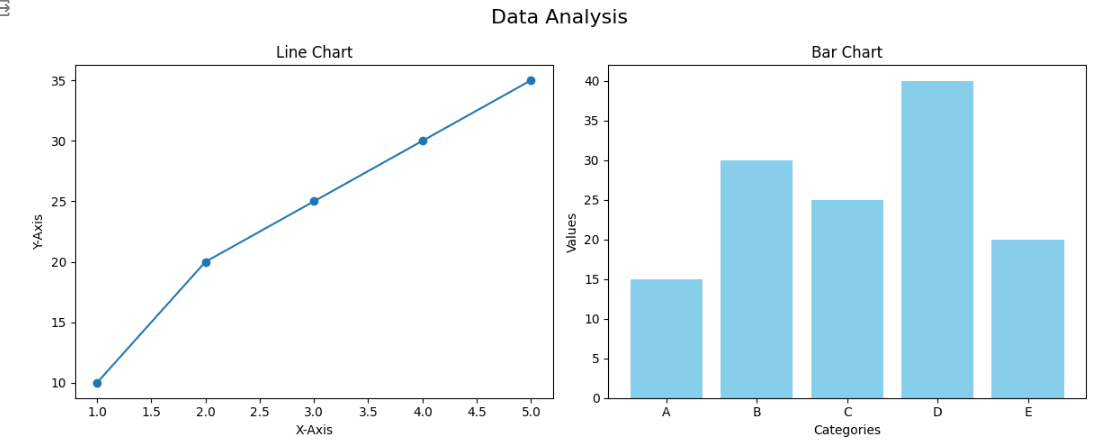
You are working on a data visualization project and need to create a figure with multiple subplots to display different aspects of your data. Additionally, you want to set a main title for the entire figure. Your task is to:
- Create a figure with two subplots arranged in a 1x2 grid.
- Set the main title of the figure to "Data Analysis."
- In the first subplot, plot a line chart for the data.
- In the second subplot, plot a bar chart for a related set of data.
import matplotlib.pyplot as plt
import numpy as np

# Create a figure with two subplots arranged in a 1x2 grid
plt.figure(figsize=(12, 5))

# Set the main title of the figure
plt.suptitle("Data Analysis", fontsize=16)

# First subplot: Line chart
plt.subplot(1, 2, 1)
x1 = np.array([1, 2, 3, 4, 5])
y1 = np.array([10, 20, 25, 30, 35])
plt.plot(x1, y1, marker='o', linestyle='-')
plt.title("Line Chart")
plt.xlabel("X-Axis")
plt.ylabel("Y-Axis")

# Second subplot: Bar chart
plt.subplot(1, 2, 2)
x2 = np.array(['A', 'B', 'C', 'D', 'E'])
y2 = np.array([15, 30, 25, 40, 20])
plt.bar(x2, y2, color='skyblue')
plt.title("Bar Chart")
plt.xlabel("Categories")
plt.ylabel("Values")

# Display the subplots
plt.tight_layout()
plt.show()
Result