
| 일 | 월 | 화 | 수 | 목 | 금 | 토 |
|---|---|---|---|---|---|---|
| 1 | 2 | 3 | 4 | 5 | ||
| 6 | 7 | 8 | 9 | 10 | 11 | 12 |
| 13 | 14 | 15 | 16 | 17 | 18 | 19 |
| 20 | 21 | 22 | 23 | 24 | 25 | 26 |
| 27 | 28 | 29 | 30 |
- polynomial regression
- matplotlib.pyplot
- AS
- error
- Else
- PANDAS
- start exercise
- pie charts
- line color
- Default X points
- iterates
- multiple lines
- Text Analytics
- MySQL
- Text mining
- matplotlib
- machine learning
- variables
- data distribution
- For loops
- self parameter
- Github
- break
- SQL
- continue
- line width
- __init__
- PROJECT
- Python
- train/test
- Today
- Total
Data Science Explorer
Matplotlib: Matplotlib Adding Grid Lines 본문
- Add Grid Lines to a Plot
You can use the grid() function to add grid lines to the plot.
Example
import matplotlib.pyplot as plt
import numpy as np

x = np.array([80, 85, 90, 95, 100, 105, 110, 115, 120, 125])
y = np.array([240, 250, 260, 270, 280, 290, 300, 310, 320, 330

plt.title ("The Office Watch Data")
plt.xlabel("Average Pulse")
plt.ylabel("Calorie Burnage")

plt.plot(x, y)

plt.grid()

plt.show()
Result

- Specify Which Grid Lines to Display
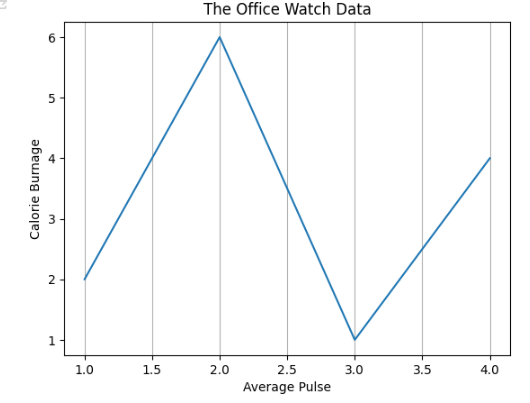
You can use axis() parameter in the grid() function to specify which grid lines to display.
Example
import matplotlib.pyplot as plt
import numpy as np

x = np.array ([1, 2, 3, 4])
y = np.array ([2, 6, 1, 4])

plt.title("The Office Watch Data")
plt.xlabel("Average Pulse")
plt.ylabel("Calorie Burnage")


plt.plot(x,y)
plt.grid(axis = 'x')

plt.show()
Result
- Set Line Properties for the Grid
You can adjust the color, linestyle and width of the grid as we learned.
import numpy as np
import matplotlib.pyplot as plt

x = np.array([80, 85, 90, 95, 100, 105, 110, 115, 120, 125])
y = np.array([240, 250, 260, 270, 280, 290, 300, 310, 320, 330])

plt.title("The Office Watch Data")
plt.xlabel("Average Pulse")
plt.ylabel("Calorie Burnage")

plt.plot(x, y)

plt.grid(color = 'green', linestyle = '--', linewidth =0.8)

plt.show()
Result

Exercise
You are working with a data visualization library in Python and are creating a grid for a chart. Your task is to set the line properties of the grid to customize its appearance. Specifically, you need to set the line color to "gray," line style to "dashed," and line width to 1.5 points.
Provide the code or method you would use to set these line properties for the grid.
# Set the line properties of the grid to:
# - Line color: "gray"
# - Line style: "dashed"
# - Line width: 1.5 points
import matplotlib.pyplot as plt
import numpy as np

x = ([2, 5, 7, 1, 9])
y = ([2, 5, 7, 1, 9])

plt.plot(x, y)
plt.grid(c = 'gray', ls = 'dashed', lw = '1.5')

plt.show()
Result

'Python' 카테고리의 다른 글
| Matplotlib Scatter (0) | 2023.11.08 |
|---|---|
| Matplotlib Subplot (0) | 2023.11.07 |
| Matplotlib: Matplotlib Line (0) | 2023.11.05 |
| Matplotlib: Matplotlib Labels and Title (0) | 2023.11.05 |
| Matplotlib: Matplotlib Markers (2) | 2023.11.04 |


