
Notice
Recent Posts
Recent Comments
Link
| 일 | 월 | 화 | 수 | 목 | 금 | 토 |
|---|---|---|---|---|---|---|
| 1 | 2 | 3 | 4 | 5 | ||
| 6 | 7 | 8 | 9 | 10 | 11 | 12 |
| 13 | 14 | 15 | 16 | 17 | 18 | 19 |
| 20 | 21 | 22 | 23 | 24 | 25 | 26 |
| 27 | 28 | 29 | 30 |
Tags
- SQL
- matplotlib
- iterates
- start exercise
- MySQL
- Default X points
- continue
- break
- variables
- Text mining
- self parameter
- AS
- data distribution
- Text Analytics
- train/test
- line width
- For loops
- multiple lines
- PANDAS
- line color
- pie charts
- PROJECT
- matplotlib.pyplot
- polynomial regression
- Else
- Github
- Python
- error
- __init__
- machine learning
Archives
- Today
- Total
Data Science Explorer
Matplotlib: Matplotlib Plotting 본문
반응형
The plot() function is used to draw points (markers) in a diagram.
Parameter 1 is an array containing the points on the x-axis.
Parameter 2 is an array containing the points on the y-axis.
- Plotting Without Line
You can use shortcut string notation parameter 'o', which means rings.
Example
Draw two points in the diagram, one at position (1,1) and one in position (6,10).
# Draw two points in the diagram, one at position (1,1) and one in position (6,10).

import matplotlib.pyplot as plt
import numpy as np

xpoints = np.array ([1,1])
ypoints = np.array([6,10])

plt.plot (xpoints, ypoints, 'o')
plt.show()
Result

- Multiple Points
Example
Draw a line in a diagram from position (1, 1) to (2, 8) then to (8, 2) and finally to position (9, 10).
#Draw a line in a diagram from position (1, 1) to (2, 8) then to (8, 2) and finally to position (9, 10).
import matplotlib.pyplot as plt
import numpy as np

xpoints = np.array([1, 2, 8, 9])
ypoints = np.array ([1, 8, 2, 10])

plt.plot(xpoints, ypoints)

plt.show()
Result

- Default X points
If you don't specify the xpoint, it will default the xpoint depending on the length of the y points.
Example
Plotting without x-points:
import matplotlib.pyplot as plt
import numpy as np

ypoints = np.array ([2, 4, 6, 8])

plt.plot(ypoints)
plt.show()
Result

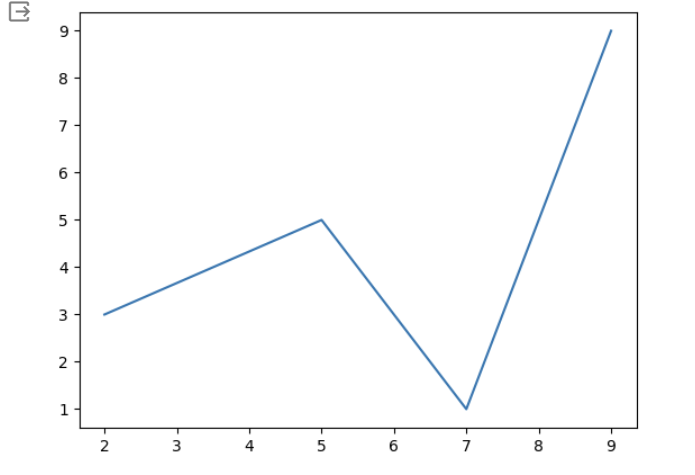
Exercise
Draw a line in a diagram from position (2, 3) to (5, 5) and then to (7, 1) and finally to position (9, 9).
import matplotlib.pyplot as plt
import numpy as np

xpoints = ([2, 5, 7, 9])
ypoints = ([3, 5, 1, 9])

plt.plot(xpoints, ypoints)
plt.show()
Result
'Python' 카테고리의 다른 글
| Matplotlib: Matplotlib Labels and Title (0) | 2023.11.05 |
|---|---|
| Matplotlib: Matplotlib Markers (2) | 2023.11.04 |
| Matplotlib: Matplotlib Pyplot (0) | 2023.11.04 |
| Matplotlib (0) | 2023.11.04 |
| Pandas: Removing Duplicates (0) | 2023.10.30 |
'Python' Related Articles
more


