
| 일 | 월 | 화 | 수 | 목 | 금 | 토 |
|---|---|---|---|---|---|---|
| 1 | 2 | 3 | 4 | 5 | ||
| 6 | 7 | 8 | 9 | 10 | 11 | 12 |
| 13 | 14 | 15 | 16 | 17 | 18 | 19 |
| 20 | 21 | 22 | 23 | 24 | 25 | 26 |
| 27 | 28 | 29 | 30 |
- __init__
- self parameter
- break
- Text Analytics
- multiple lines
- AS
- Default X points
- polynomial regression
- error
- PROJECT
- Github
- matplotlib.pyplot
- Python
- start exercise
- train/test
- pie charts
- variables
- machine learning
- iterates
- Else
- MySQL
- Text mining
- PANDAS
- data distribution
- line width
- line color
- continue
- SQL
- For loops
- matplotlib
- Today
- Total
Data Science Explorer
Matplotlib: Matplotlib Markers 본문
- Markers
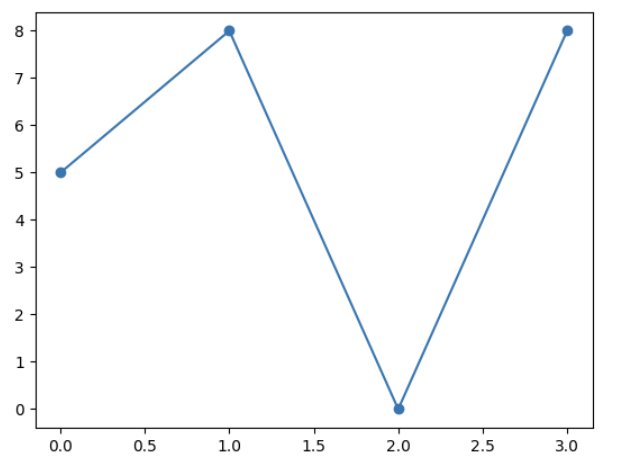
When you want to emphasize each point with a specified marker, you can use the argument marker.
Example
Mark each point with a circle.
import matplotlib.pyplot as plt
import numpy as np

ypoints =([5, 8, 0, 8])
plt.plot (ypoints, marker = 'o')
plt.show()
Result
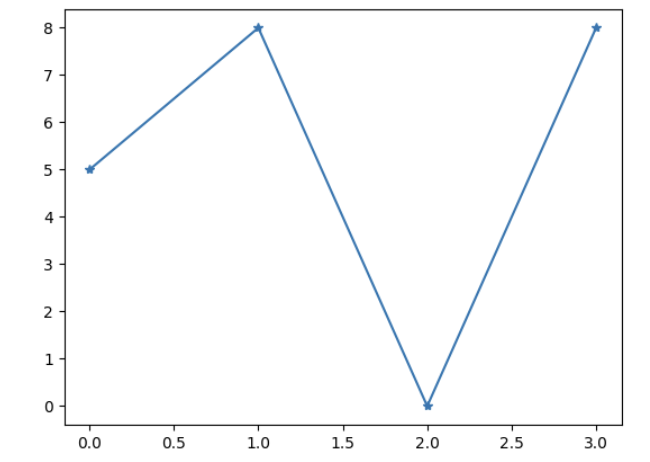
Mark each point with a star.
Result
- Marker Reference
| Marker | Description |
| 'o' | Circle |
| '*' | Star |
| '.' | Point |
| ',' | Pixel |
| 'x' | X |
| 'X' | X (filled) |
| '+' | Plus |
| 'P' | Plus (filled) |
| 's' | Square |
| 'D' | Diamond |
| 'd' | Diamond (thin) |
| 'p' | Pentagon |
| 'H' | Hexagon |
| 'h' | Hexagon |
| 'v' | Triangle Down |
| '^' | Triangle Up |
| '<' | Triangle Left |
| '>' | Triangle Right |
| '1' | Tri Down |
| '2' | Tri Up |
| '3' | Tri Left |
| '4' | Tri Right |
| '|' | Vline |
| '_' | Hline |
- Format Strings fmt
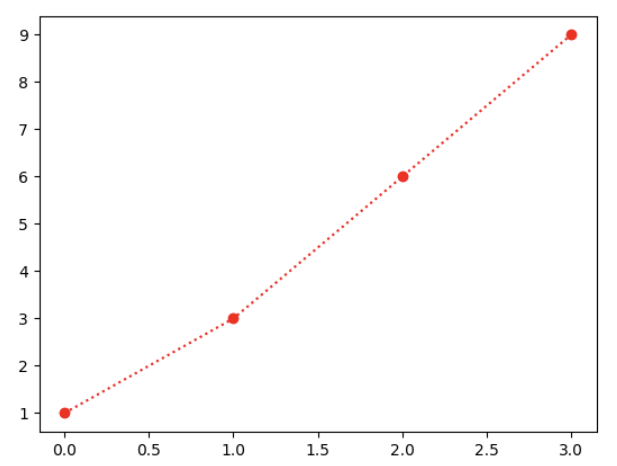
You can also use shortcut string notation parameter to specify the marker which is called fmt.
Fmt has the following syntax:
marker \ line \ color
Example
import matplotlib.pyplot as plt
import numpy as np

ypoints = ([1,3,6,9])
plt.plot(ypoints, 'o:r')

plt.show()
Result
- Line Referecne
| Line Syntax | Description |
| '-' | Solid line |
| ':' | Dotted line |
| '--' | Dashed line |
| '-.' | Dashed/dotted line |
- Color Reference
| Color Syntax | Description |
| 'r' | Red |
| 'g' | Green |
| 'b' | Blue |
| 'c' | Cyan |
| 'm' | Magenta |
| 'y' | Yellow |
| 'k' | Black |
| 'w' | White |
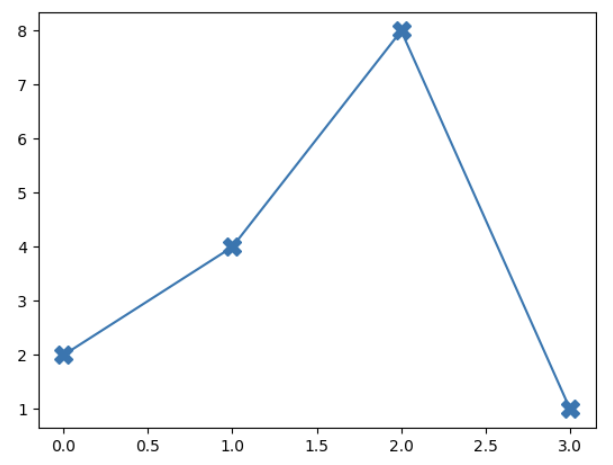
- Marker Size
We can address the size of the marker by using ms.
Example
Set the size of the markers to 20.
import matplotlib.pyplot as plt
import numpy as np
ypoints = ([2, 4, 8, 1])
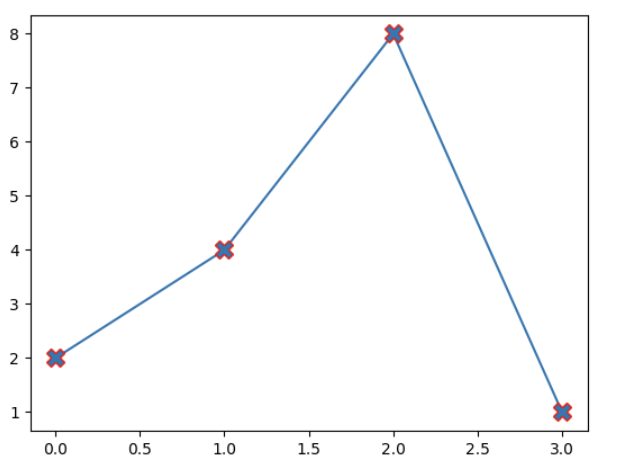
plt.plot(ypoints, marker = 'X', ms = 12)
plt.show()
Result
- Marker Color
You can use the keyword argument markeredgecolor or mec to set the color of the edge of the marker.
Example
Set the EDGE color to red.
import matplotlib.pyplot as plt
import numpy as np
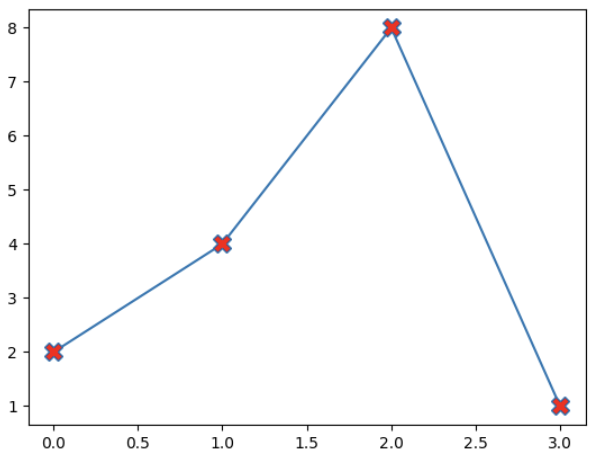
ypoints = ([2, 4, 8, 1])
plt.plot(ypoints, marker = 'X', ms = 12, mec = 'r')
plt.show()
Result
You can use mfc to fill the color of the marker.
Example
Set the FACE color to red.
import matplotlib.pyplot as plt
import numpy as np

ypoints = ([2, 4, 8, 1])

plt.plot(ypoints, marker = 'X', ms = 12, mfc = 'r')
plt.show()
Result
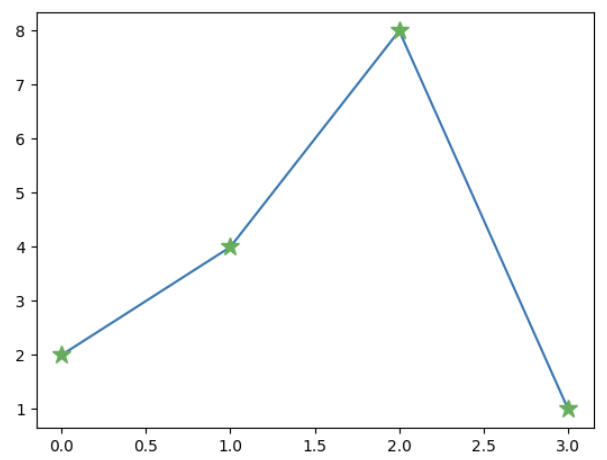
You can also change the color with Hexadecimal color values.
Example
import matplotlib.pyplot as plt
import numpy as np

ypoints = ([2, 4, 8, 1])

plt.plot(ypoints, marker = '*', ms = 12, mec = '#4CAF50', mfc = '#4CAF50' )
plt.show()
Result
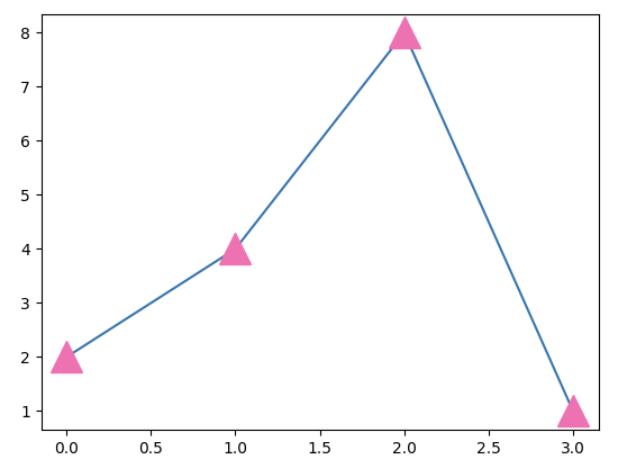
Or you can use 140 supported color names.
...
plt.plot(ypoints, marker = 'o', ms = 12, mec = 'hotpink', mfc = 'hotpink')
...
Result
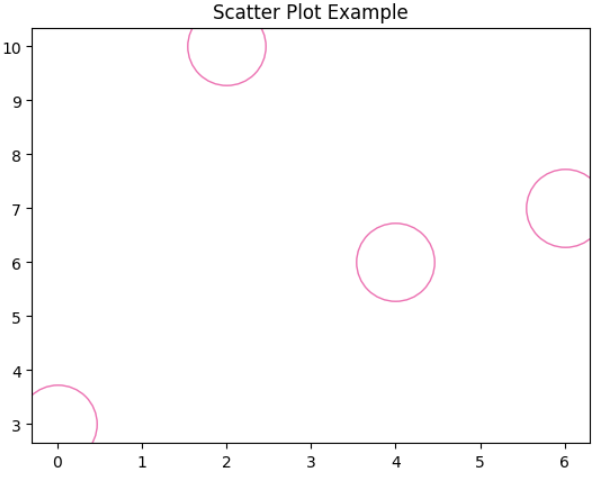
Exercise
Create a scatter plot using matplotlib.pyplot to visualize the relationship between two variables, 'X' and 'Y.' Use blue circular markers (o) with a size of 50, and label it 'Data Points.' Customize the marker style, size, and color to your preference to make the plot visually appealing.
import matplotlib.pyplot as plt
import numpy as np

xpoints= ([0, 4, 6, 2])
ypoints = ([3, 6, 7, 10])

plt.plot(xpoints, ypoints, marker= 'o', ms = 50, c= 'w', mec = 'hotpink', label = 'Data Points')
plt.title('Scatter Plot Example')
plt.show()
Result
'Python' 카테고리의 다른 글
| Matplotlib: Matplotlib Line (0) | 2023.11.05 |
|---|---|
| Matplotlib: Matplotlib Labels and Title (0) | 2023.11.05 |
| Matplotlib: Matplotlib Plotting (0) | 2023.11.04 |
| Matplotlib: Matplotlib Pyplot (0) | 2023.11.04 |
| Matplotlib (0) | 2023.11.04 |


